Measurement steps
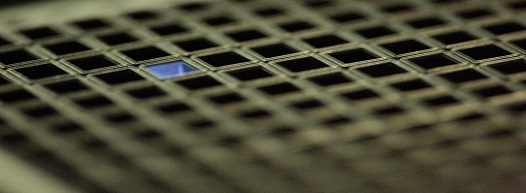
Place the focused detection spot into the sample: Measurement near the glass bottom allows miniaturized sample volumes..jpg) Start the fluctuation analysis by recording the photon count trace: Data acquisition times as short as one second are sufficient to record large datasets allowing reliable correlation analysis. 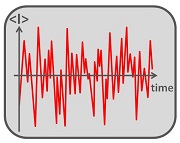 Determine the correlation: By applying the correlation function to the photon count trace the signal is scanned for self-similar patterns, giving rise to a characteristic correlation function. 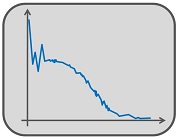 Fitting to appropriate model: By defining a biophysical diffusion model the number of molecules, size of particles and other parameters can be calculated from the correlation curve. 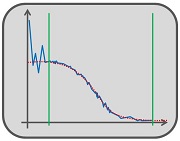 Assessing fit quality: How well the end predictions describe the system examined can be assessed from the deviations between correlated and theoretically derived models. 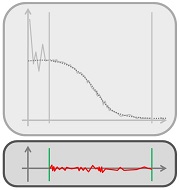 |